The high-resolution electron microscope ASTEM was equipped with a new type of detector in the framework of the project “ASTEM Upgrade” which was funded by the Zukunftsfonds Steiermark.
Since the installation of the ASTEM in summer 2011, the ASTEM has been equipped with a conventional “charge coupled device” (CCD) camera for taking images and spectra. The CCD camera, however, delivers only mediocre results for radiation-sensitive materials such as biological samples, polymer samples or 2D materials. This is due to several limiting factors such as readout noise, point spreading and scintillator sensitivity of the CCD cameras.
In order to extend the application range of the ASTEM to radiation-sensitive (“dose-limited”) materials, a new improved detection technology had to be introduced, the so-called direct electron detection cameras (DDD, direct detection device,
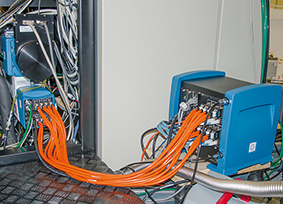
Fig.1: Direct electron detection camera “K2”
hardware setup on the ASTEM microscope.
Fig. 1). This principle very effectively eliminates all problems of the conventional CCD cameras and allows images and spectra to be generated almost noise-free and with much better resolution. Being able to count single electrons with highest sensitivity opens a wide range of 2D and 3D investigation possibilities in the field of bio- (structure elucidation) and material sciences (light metal alloys, energy materials).
Sensitive materials such as biological samples, complex polymer mixtures, light metal alloys and energy materials, for example, have been investigated at very low doses with a high detection limit for volatile and/or trace elements. On the other hand, in-situ heating experiments (imaging and EEL spectroscopy measurements) with a significant improvement in spatial and energy resolution are now possible for different functional materials as presented in Figure 2.
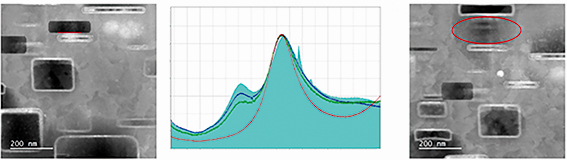
Fig. 2 in-situ heating performed for a neutron irradiated beryllium sample. HAADF images at room temperature (left) and at 520°C (right) of regions presenting rectangular gas filled (H and He) features. The EEL spectra from the marked regions at different temperatures are shown on the graph.